Sketch-texture contributions to classification
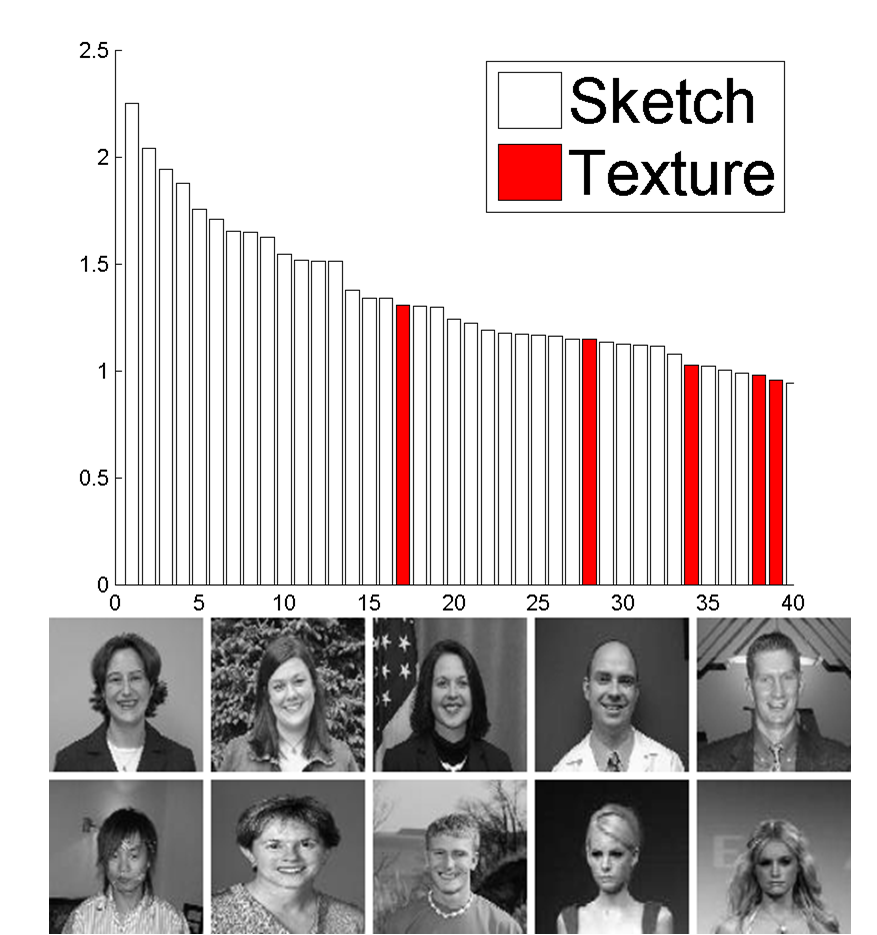
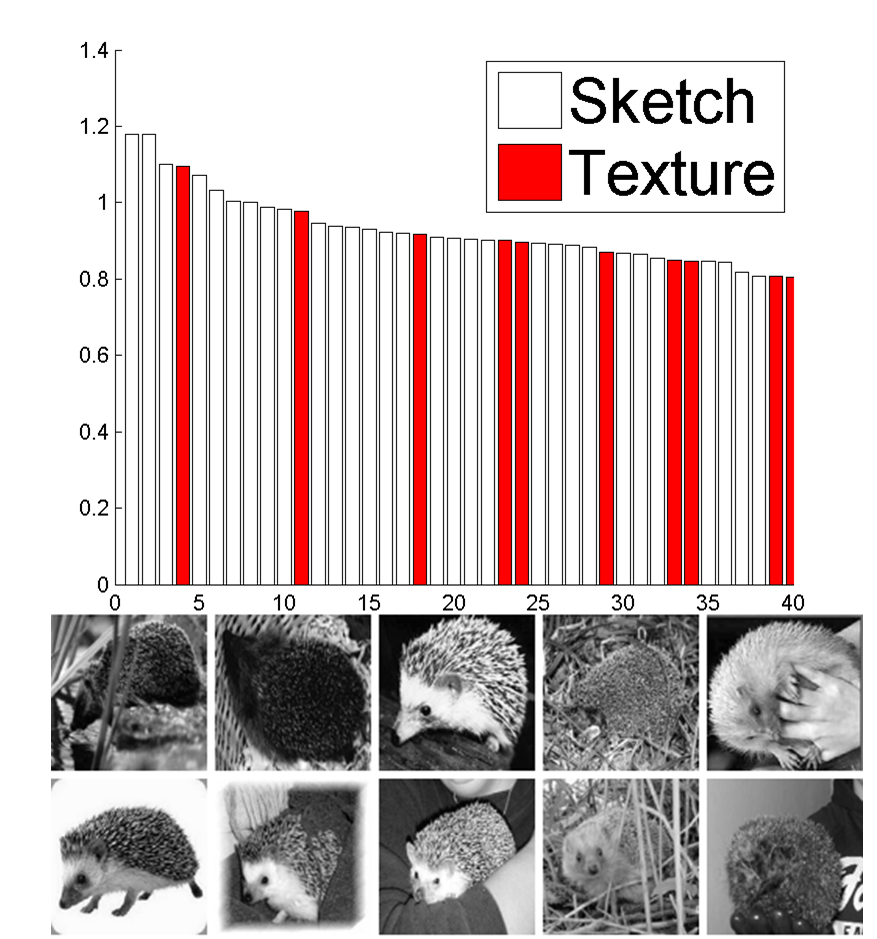
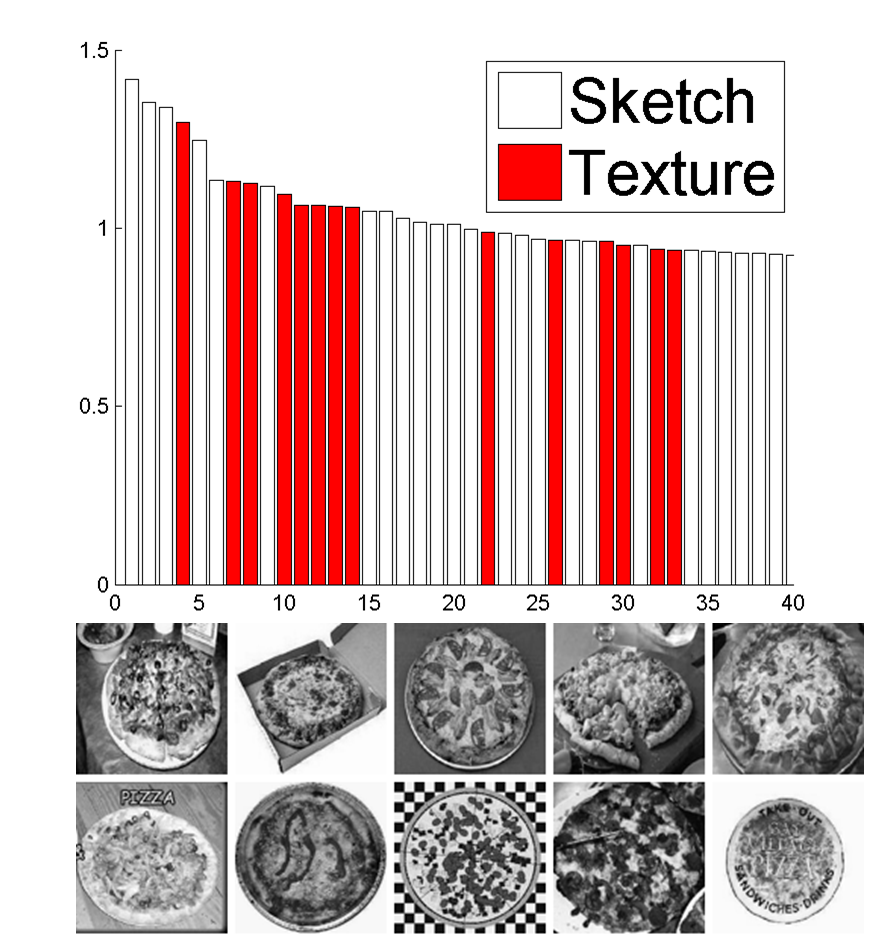
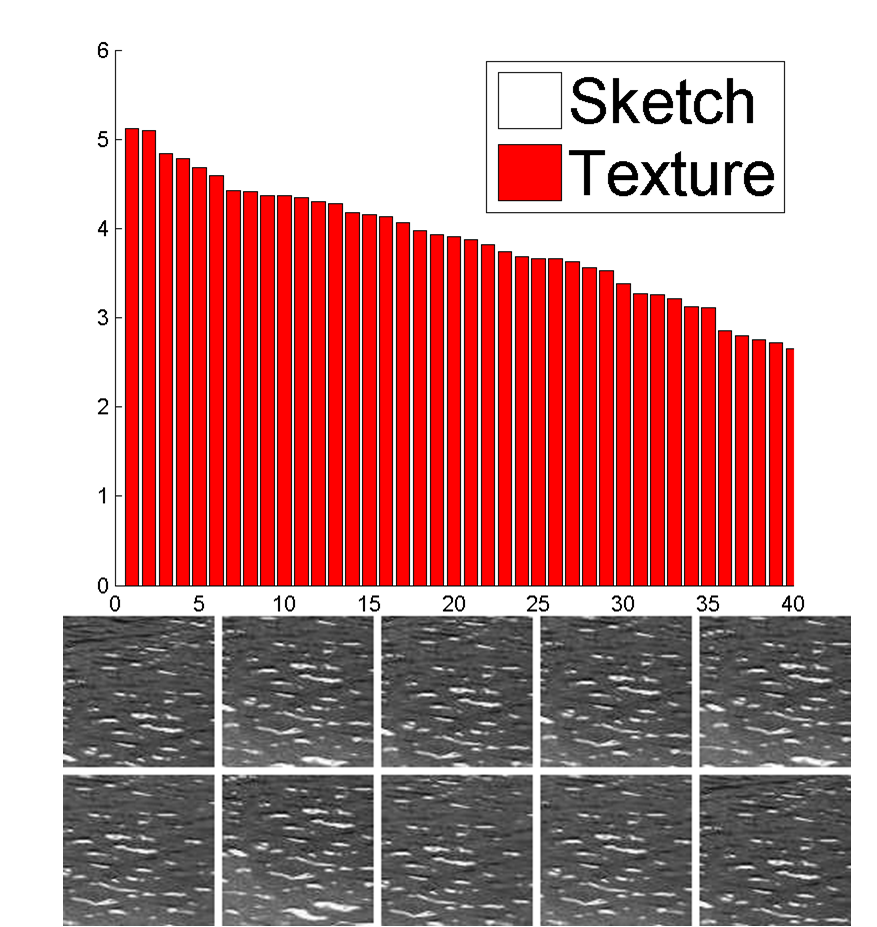
In the second experiment, we study how the sketch and texture patches are ordered by their information gains in different categories, and how much they contribute to classification.
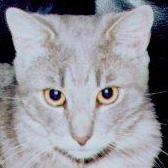
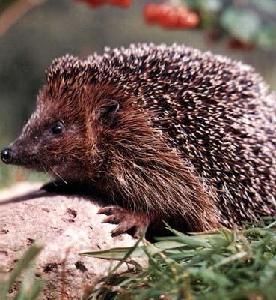
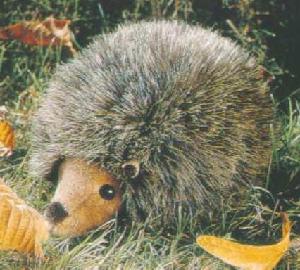
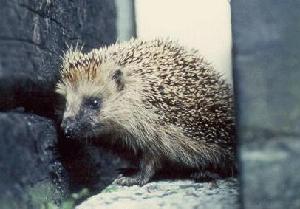
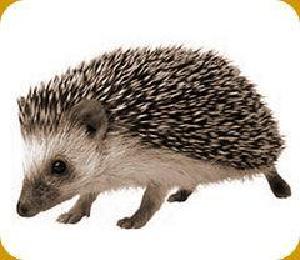
We choose four categories ranging from structured to textured: head-shoulder, hedgehog, pizza, and wavy water. Each category has 15 image examples, some of which are shown in the following figures. We plot the information gains of the selected patches in decreasing order: the hollow bars are for sketch patches and the solid (red) bars are for texture patches. For image categories with clear and regular shape, e.g., head/shoulder, sketches dominate the information gain. For hedgehog and pizza, as there are cluttered structures inside objects, texture patches make bigger contributions, and become the dominating feature in wavy water.
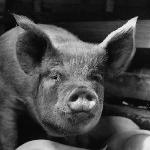
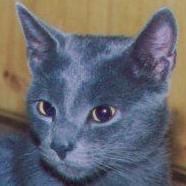
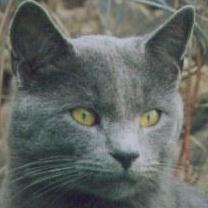
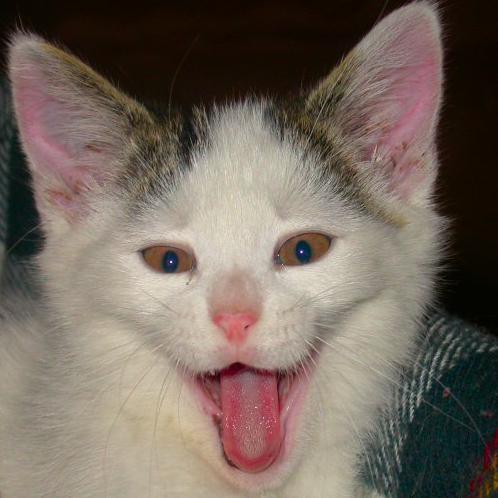
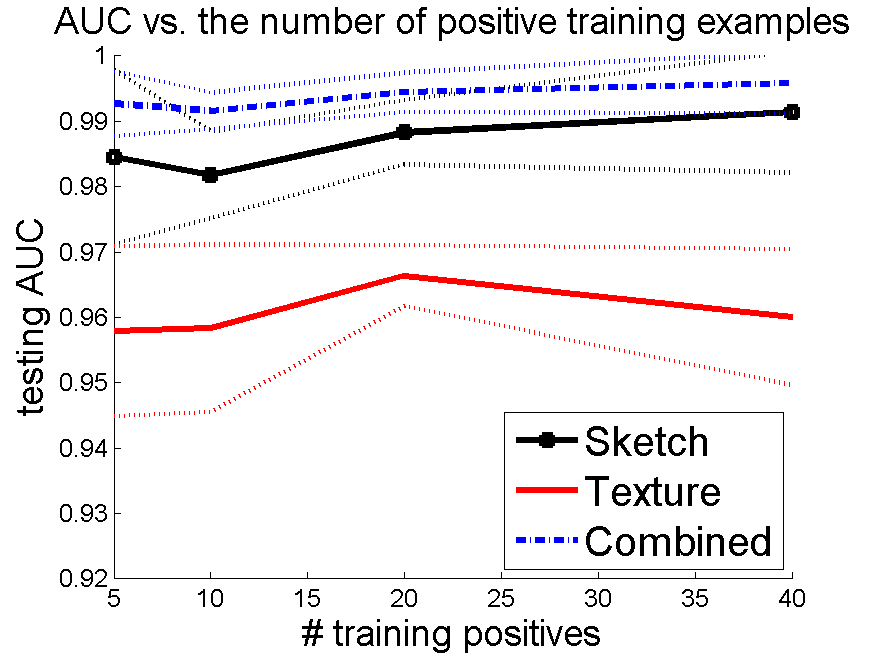
We test the contributions of sketch and texture for classification on other four categories: human head/shoulder, cat head, pig head and hedgehog. For each category, we compare the AUC performance (the area under the ROC curve) of the HiT template (combining sketch and texture) against performances using only sketch or texture patches respectively. The following figures plots the three curves with their 95% confidence intervals. Each AUC curve is averaged over 5 cross validation runs and plotted against the number of positive training examples per category.
|
Code & Data
An older version of code that reproduces the figure in the CVPR paper. |
Code & Data
An older code reproducing the CVPR paper. |
|
Code & Data
An older code reproducing the CVPR paper. |
Code & Data
An older code reproducing the CVPR paper. |


